Digital Imaging
Viewing Digital Images
Paul R. Montague, CRA FOPS
Department of Ophthalmology and Visual Sciences
The Univesity of Iowa Hospitals and Clinics
Iowa City, Iowa
Black and white digital images are images which have been divided into small square picture elements called pixels, each pixel being assigned a numeric value based upon its average gray level.
The most common way of viewing digital images is to display them on a computer monitor. The computer reads the image file. The first part of the file might contain information like the number of pixels in the image, whether it is black and white or color, and the method of image compression used, if any. After the file header is read, the program knows how to interpret the actual image data.
For an uncompressed black and white image, the value for a pixel is read from the image file, and the imaging software instructs the monitor to display a gray square on the screen with it's shade of gray depending upon the numeric value. A value of 0 will produce black, a value of 255 will produce white, and intermediate numbers will produce shades of gray.
 
|
Image displayed at 173 x 196 pixels and an enlargement of the left
eye revealing the gray pixels which make up the image.
|
The resolution that can be achieved is dependent upon the type of monitor, the type of video adapter card in the computer, and the amount of video memory installed. A high resolution Ultra VGA monitor can display up to 1024 x 1280 pixels.
The number of pixels in an image is not the only factor affecting image quality. Due to reduced video memory, some computer video modes restrict the levels of gray that can be displayed. The number of gray levels is referred to as the depth of the image. An image with pleasing and fairly accurate display characteristics at 256 levels of gray may appear uneven at 16 levels of gray. In the extreme case, only two levels are displayed, rendering the image in pure black and white with no levels of gray.
|

256 level image demonstrates
good tonal transitions.
|

16 level image demonstrates
harsher transitions.
|
|

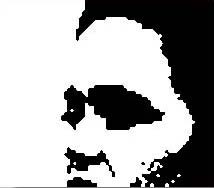
2 level image renders the image as
pure black and white.
|
Enlargement emphasizes the effects of reduced gray levels.
|

256 level image.
|

16 level image.
|
|

2 level image.
|
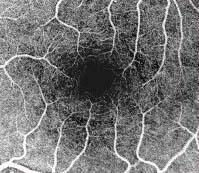
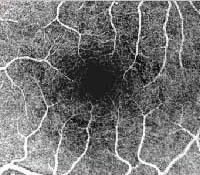
The effects of reduced depth may not appear significant
in subjects of very high contrast as demonstrated
in this fluorescein angiogram digitized at 1024 x 1024 pixels.

256 level image.
|

16 level image.
|
|


